Упражнения на выносливость стимулируют экспрессию PGC-1alpha в скелетной мышце и повышенную экспрессия PGC-1alpha ведет к изменениям метаболизма и эффективности на тренировках у мышей. Однако неясно, необходим ли PGC-1alpha в изменениях вызываемых упражнениями на выносливость в виде метаболической и сократительной адаптации в скелетных мышцах. В этом исследовании мы показали, что экспрессия митохондриальных ферментов (оксидаза цитохрома IV и цитохром c) вызванная тренировками на выносливость ведет к увеличению PECAM-1, CD31 эндотелиальных клеток в скелетной мышце, но не вела к смене типов волокон от IIb к IIa, также эта реакция была значительно снижена у мышей с отключеным мышечно-специфичным Pgc-1alpha. Интересно, добровольный бег управление эффективнее восстановил митохондриальную целостность и уровени супероксиддисмутазы (SOD2) в скелетной мышце у мышей с отключенным Pgc-1alpha. Таким образом PGC-1alpha играет функциональную роль в упражнениях на выносливость, вызванным ими митохондриальном биогенезе и ангиогенез, но не в смене типа волокон из IIb (ГМВ) в IIa (ПМВ/ОМВ) в скелетной мышце мыши, и улучшение митохондриальной морфологии, антиоксидантной защиты в ответ на упражнения на выносливость может происходить независимо от функции PGC-1alpha. Мы приходим к заключению, что полноценная работа PGC-1alpha требуется для полноценной адаптации скелетных мышц мышей к упражнениям на выносливость.
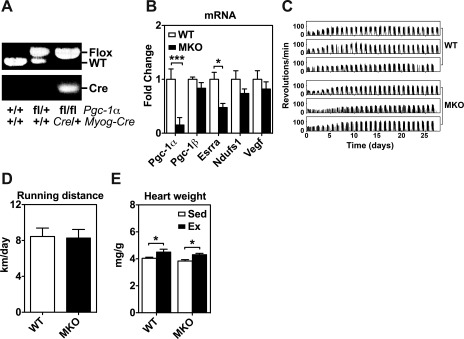
Voluntary exercise training in muscle-specific peroxisome proliferator-activated receptor γ coactivator-1α gene (Pgc-1α) knockout (MKO) and wild-type (WT) mice. A: gel images of PCR products amplified from genomic DNA from WT (Pgc-1α +/+:Myog-Cre +/+ or Pgc-1αfl/+:Myog-Cre +/+) and MKO (Pgc-1α fl/fl:Myog-Cre Cre/+) mice. B: total RNA from plantaris muscles of WT and MKO mice were assayed for mRNA expression of Pgc-1α, Pgc-1β, estrogen-related receptor α (Esrra), NADH dehydrogenase (ubiquinone) Fe-S protein 1 (Ndufs1), and vascular endothelial growth factor (Vegf) by real-time PCR. 18S ribosomal RNA was used to normalize the expression (n = 6). *P < 0.05, ***P < 0.001. C: representative running activity recording. Six continuous voluntary running activity recordings are shown for WT and MKO mice during the 4 wk of voluntary running. Each of the clusters of running activities (spikes) that correspond to a duration of half-day represents the nocturnal running activity at night. D: daily voluntary running distance in WT and MKO mice during the 4 wk of voluntary running (P = 0.99). Values are means ± SE (n = 7). E: heart weight (normalized by body weight) in sedentary (Sed) and 4-wk endurance exercise-trained (Ex) WT and MKO mice (n = 6–7). *P < 0.05.
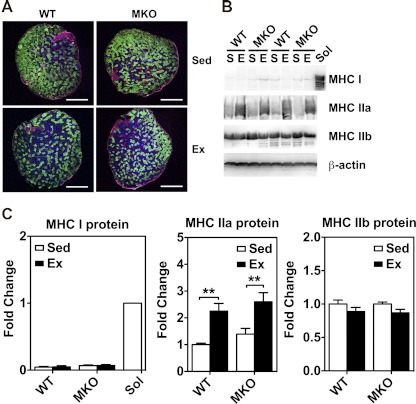
Immunofluorescence and immunoblot analyses for fiber-type composition in plantaris muscles of sedentary (Sed) and 4-wk endurance exercise-trained (Ex) WT and MKO mice. A: cross sections of plantaris muscles were immunostained for myosin heavy chains (MHC) I (red), IIa (blue), and IIb (green). Bars, 500 μm. All the fibers were counted and measured for cross-sectional area for calculation of fiber-type composition (please see Table 1). B: immunoblot analysis of MHC I, MHC IIa, and MHC IIb in plantaris muscles from sedentary (S) and endurance exercise-trained (E) mice with β-actin as loading control. Soleus muscle (Sol) was used as a positive control for MHC I. C: quantifications of MHC I, MHC IIa, and MHC IIb protein expression in plantaris muscles. Values are means ± SE (n = 6–7). **P < 0.01.
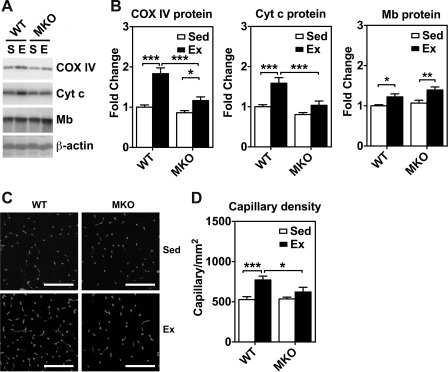
Immunoblot analysis for myoglobin and mitochondrial enzymes and immunofluorescence analysis for capillary density in skeletal muscles of sedentary (Sed) and 4-wk endurance exercise-trained (Ex) WT and MKO mice. A: immunoblot analysis of cytochrome oxidase IV (COX IV), cytochrome c (Cyt c), and myoglobin (Mb) protein expression in plantaris muscles from sedentary (S) and endurance exercise trained mice (E) with β-actin as loading control. Each lane was loaded with 40 μg of muscle protein from whole muscle homogenates. B: quantifications of COX IV, Cyt c and Mb protein expression in plantaris muscle (n = 6–7). *P < 0.05, **P < 0.01, ***P < 0.001. C: immunofluorescence staining of endothelial cells with anti-CD31 antibody in cross sections of plantaris muscle. Bars = 100 μm. D: quantifications of capillary density in plantaris muscle (n = 6–7). *P < 0.05, ***P < 0.001, respectively.
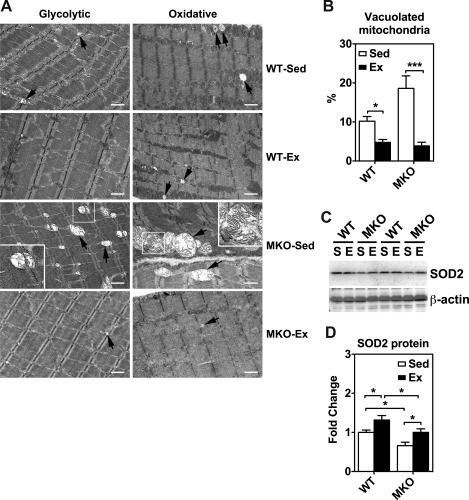
Transmission electron microscopy (TEM) analysis for mitochondrial morphology and immunoblot analysis for antioxidant enzyme expression in plantaris muscles of sedentary (Sed) and 4-wk endurance exercise-trained (Ex) WT and MKO mice. A: TEM images of longitudinal plantaris muscle sections of glycolytic and oxidative myofibers. Arrows show degenerative mitochondrion. To show detailed structure of some degenerative mitochondria, cropped images are shown with 2.5× magnification of the original images on one corner. Bars = 1 μm. B: quantification of abnormal mitochondria in ≥14 randomly acquired images as a percentage of total mitochondria. *P < 0.05, ***P < 0.001, respectively. C: immunoblot analysis of superoxide dismutase 2 (SOD2) protein expression in plantaris muscles from sedentary (S) and endurance exercise trained mice (E) with β-actin as loading control. Each lane was loaded with 40 μg of muscle protein from whole muscle homogenates. D: quantifications of SOD2 protein expression in plantaris muscle (n = 5–7). *P < 0.05.
Гэн T1, Ли П, Okutsu M, Инь X, Kwek J, Чжан М, Ян.
